CBCL
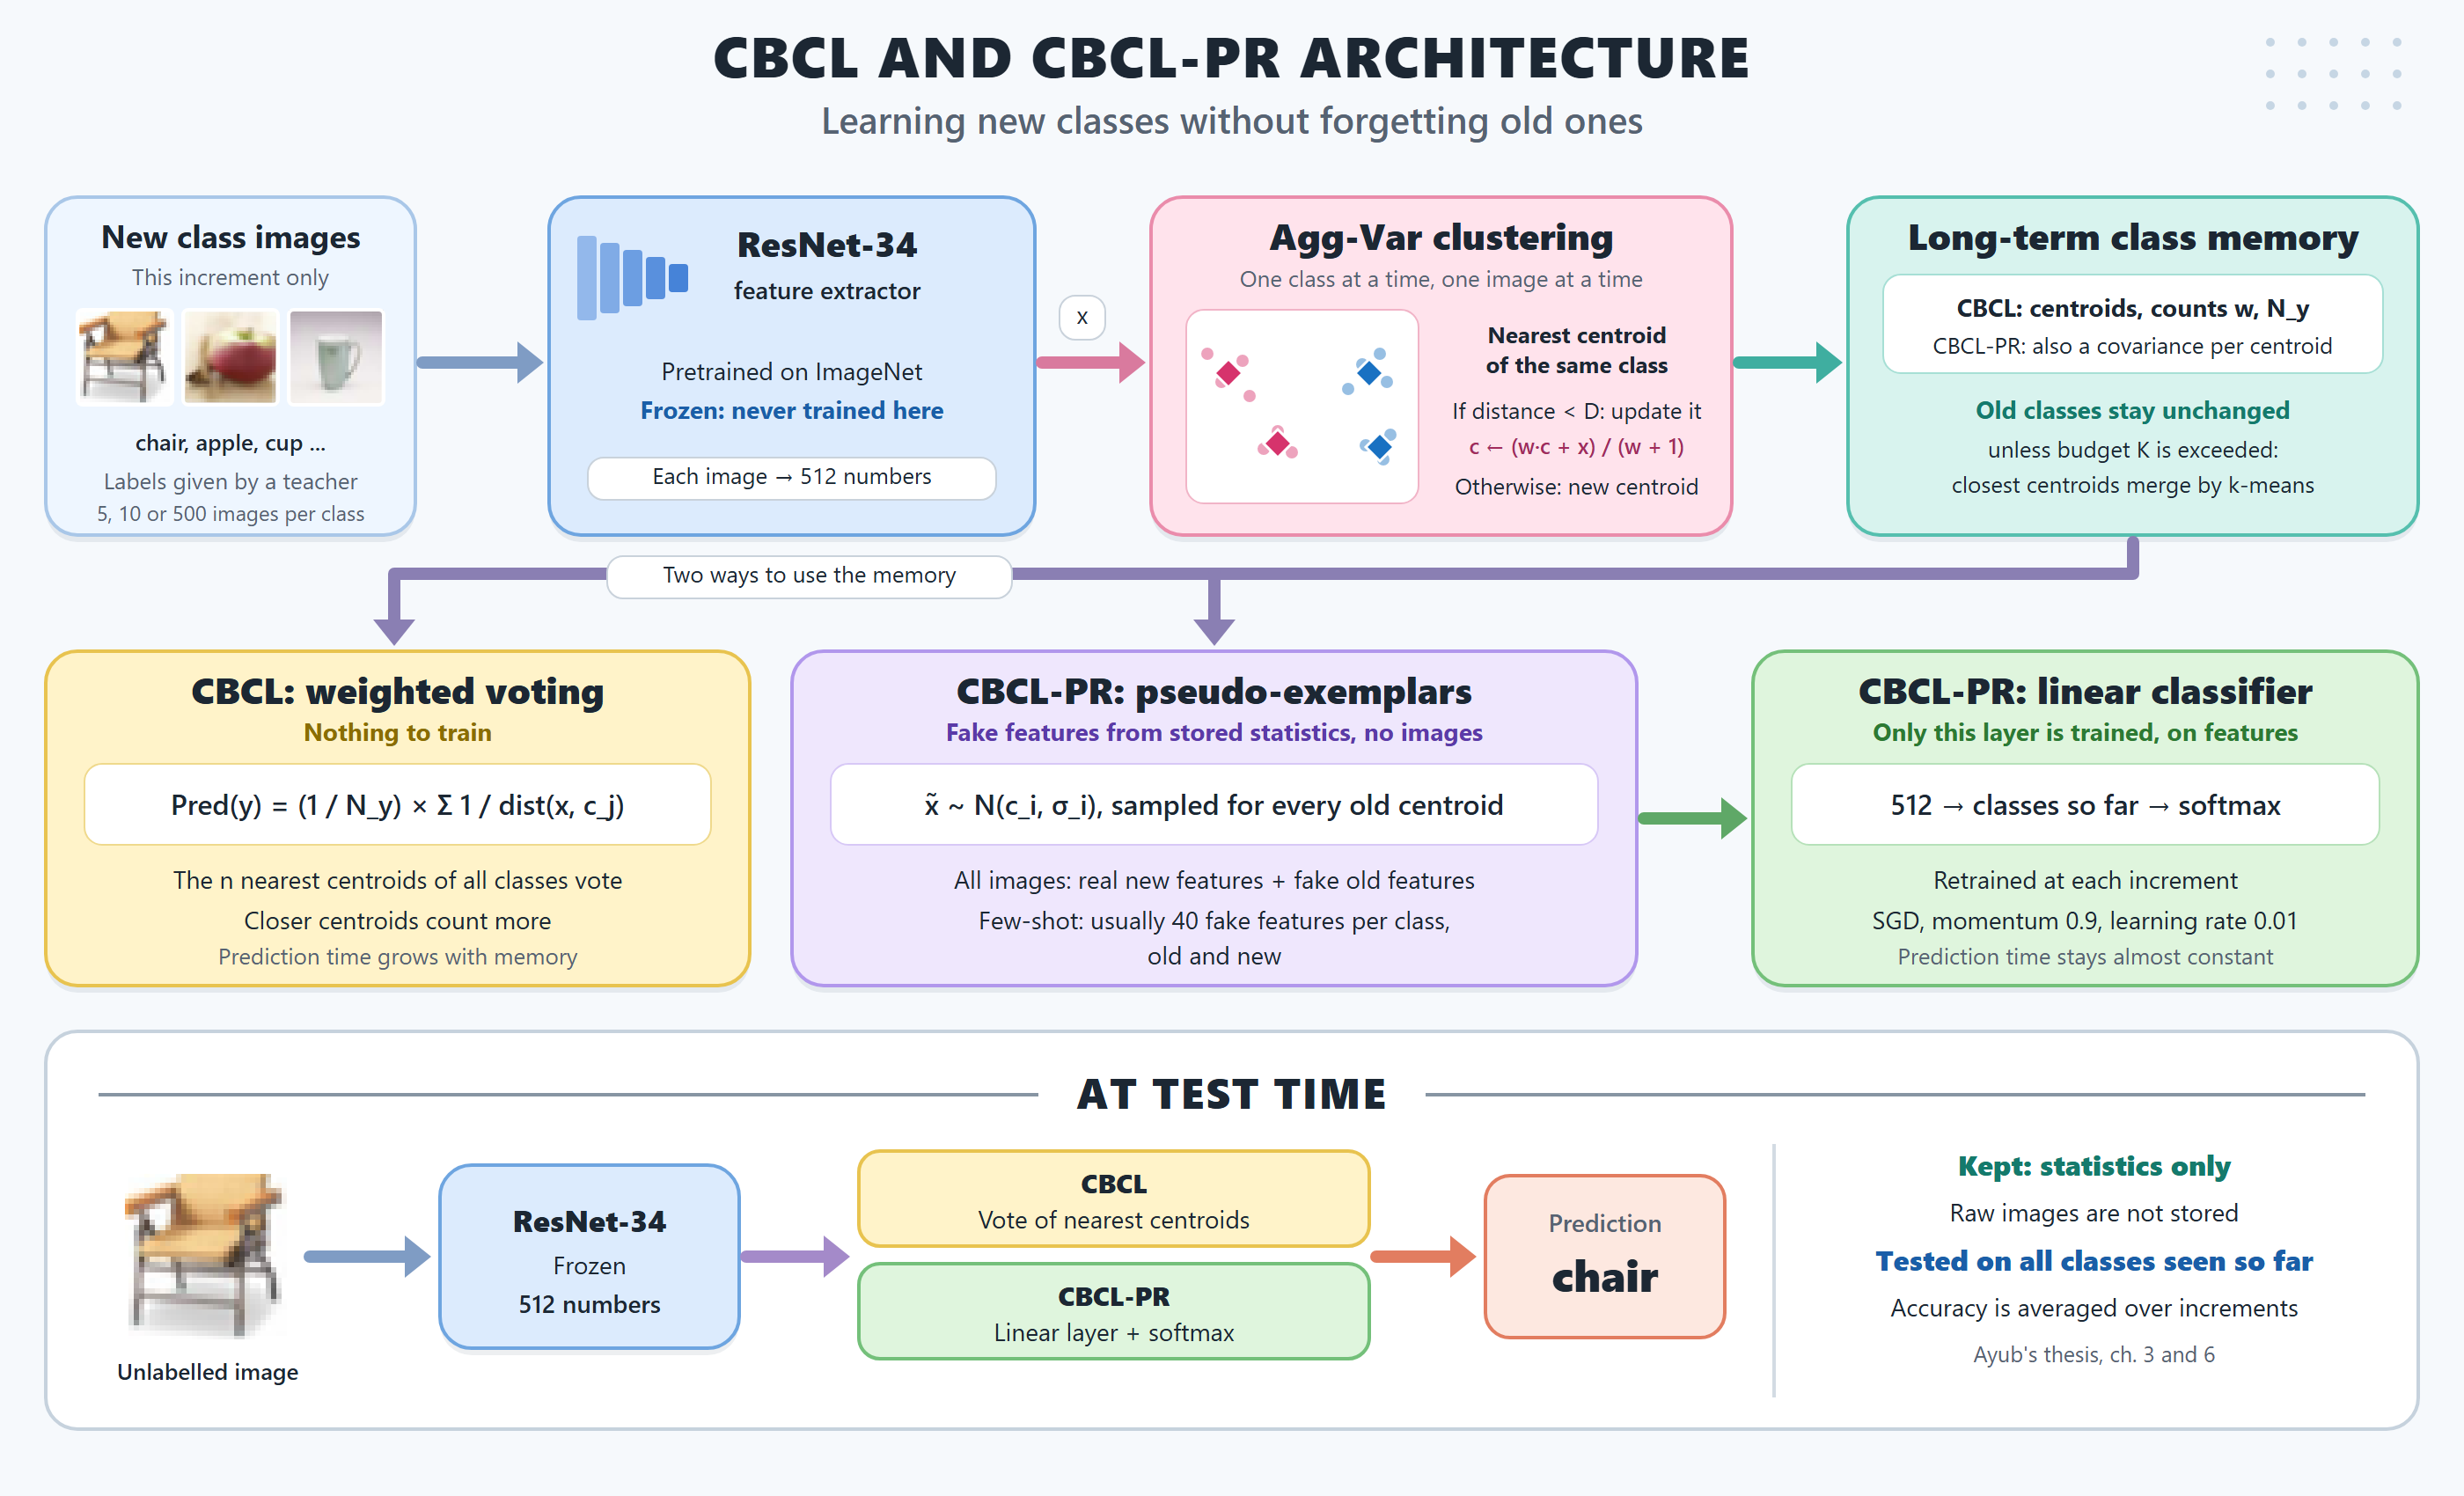
Centroid-Based Concept Learning learns new classes a few at a time without forgetting old ones. It never retrains a network. It keeps each class as a small set of points, called centroids, and classifies a new image by a vote of the nearest ones.
Training architecture


The parts
ResNet
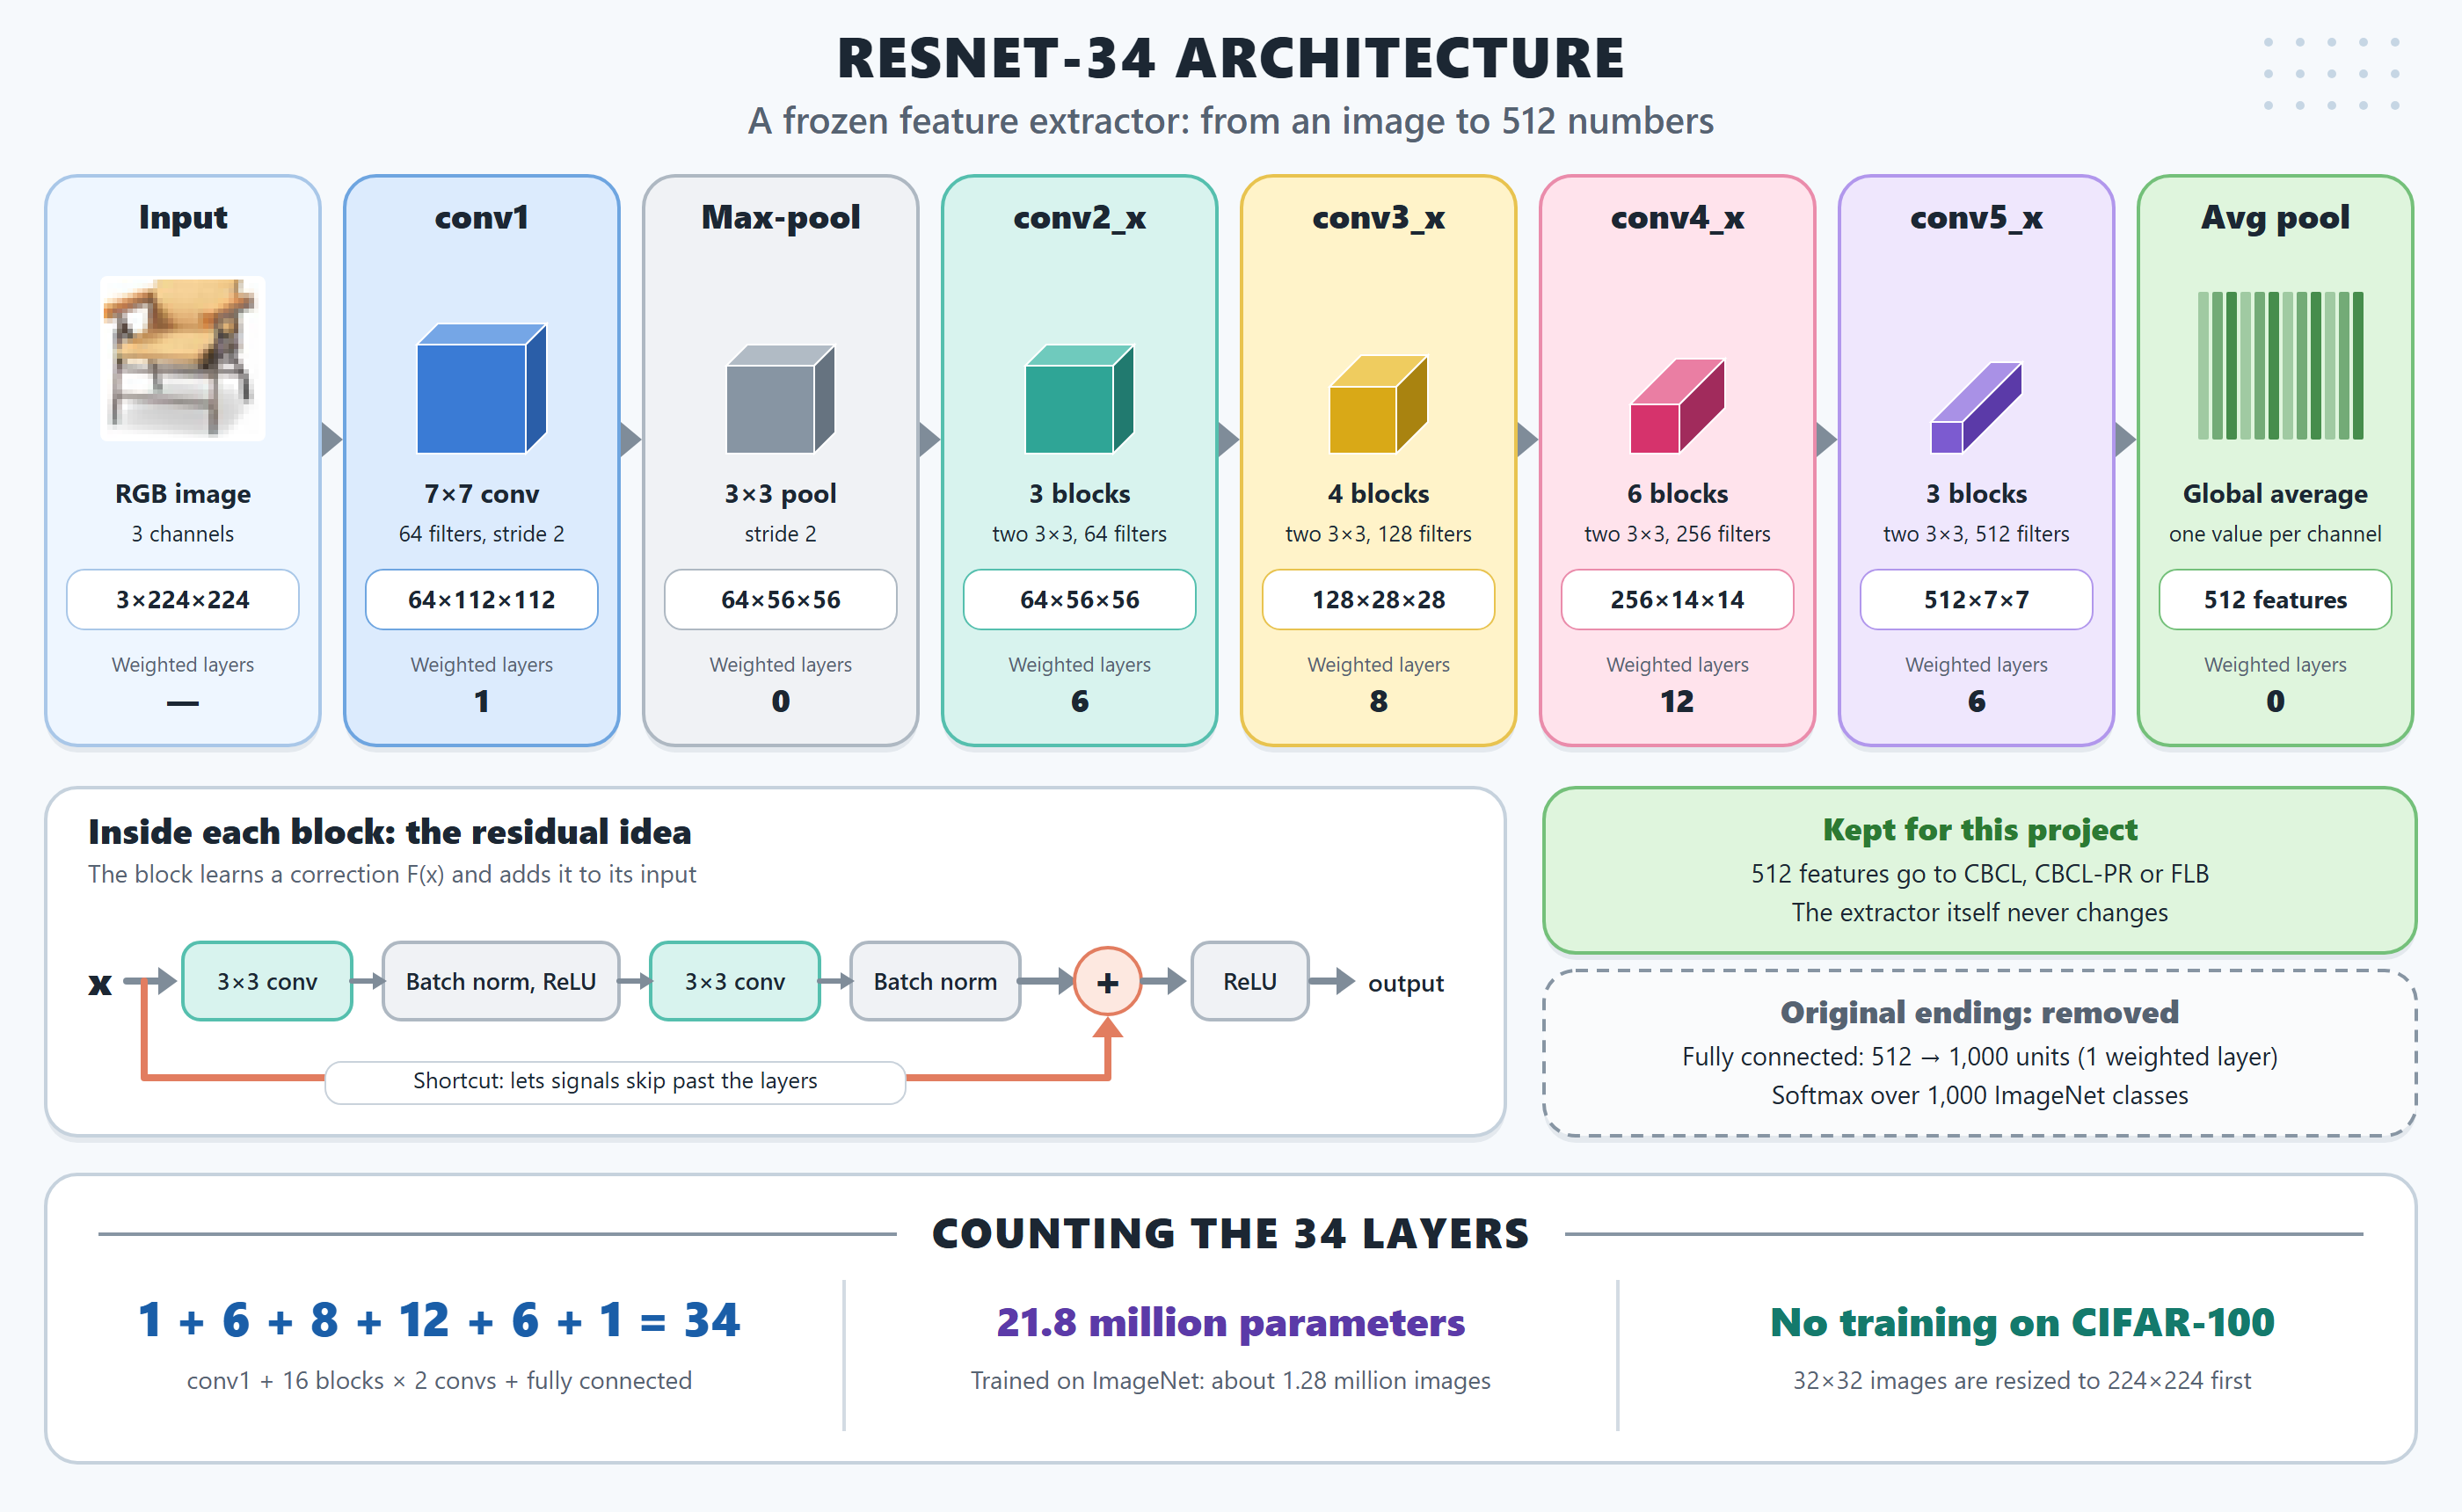
A network pretrained on ImageNet turns each image into 512 numbers. It stays frozen, so learning new classes can't damage old knowledge. Its final 1,000-class layer is removed.
ResNet-34 for CIFAR-100, ResNet-18 for the other two datasets. See every ResNet-34 layer.
Agg-Var clustering
Each class is learned on its own, one image at a time. Find the nearest centroid of the same class:
- Closer than distance
D: the image joins it, and the centroid moves towards it. - Otherwise: the image starts a new centroid.
c is the centroid, w the images it holds, and x the new image's features.
Long-term class memory
For each class, memory keeps its centroids, how many images each holds, and the class total N. Raw images aren't kept, and old classes stay unchanged.
If memory passes a budget K, old classes shrink in proportion to their size: k-means merges each one's centroids into fewer.
Weighted voting
Nothing is trained for this. At test time, the n nearest centroids from all classes vote. A closer centroid counts more, and each class's total is divided by its image count, so classes with many images don't win just for being large.
The sum covers those of the n nearest centroids c_j that belong to class y. The class with the highest score wins. This is the thesis's formula, and the official code's differs (see Results).
Testing architecture
Vote of the nearest neighbours
Change n to see how the answer changes. These are made-up 2-D points with made-up image counts, to show the idea. Real features have 512 numbers.
CBCL-PR
CBCL with Pseudo-Rehearsal builds the same memory as CBCL, but also remembers how spread out each centroid is. It uses this to generate fake features of old classes, then trains a small classifier on them. Voting isn't needed, and old images still aren't kept.
Training architecture
The parts
ResNet
The same frozen network as CBCL, with the same 512 numbers per image. Only the classifier at the end is ever trained.
ResNet-34 for CIFAR-100, ResNet-18 for the other two datasets.
Agg-Var clustering, with spread
The join-or-start rule with distance D is the same as in CBCL. The difference is that each centroid also records how its images are spread around it, as a covariance.
A centroid holding one image has no spread, so all its fake features match it exactly.
Long-term class memory
Each centroid is stored as a mean, a covariance and a count. A covariance takes far more room than a point, and the thesis gives CBCL-PR a smaller budget K: for example, 1,600 centroids instead of 7,500 on CIFAR-100.
Old classes shrink by k-means when the budget is passed, as in CBCL. Raw images still aren't kept.
Pseudo-exemplars
These are fake features, not images. Each is drawn at random from a centroid's stored mean and covariance:
x̃ ~ N(c_i, Σ_i)- Few images per class: about 40 fake features for every class, old and new.
- All images: fake features for old classes, real ones for the new classes.
Linear layer + softmax
One layer maps the 512 numbers to one output per class so far. It restarts from random weights at each step and trains on the features above, so old classes keep being rehearsed without their images.
SGD, momentum 0.9, learning rate 0.01, batch size 64, 25 epochs plus 5 more per step.
Testing architecture
The softmax decision
This replaces the vote. The layer gives each class a score, and softmax turns the scores into probabilities that add up to 100%. The numbers below are made up, to show the idea.
x is the 512 numbers and W the trained layer. Prediction is one matrix multiplication, so its time doesn't depend on how many centroids are stored.
Comparison
Both methods extract features and cluster them in the same way. They differ in what they store and how they make a decision.
Learning phase
| Learning | CBCL | CBCL-PR | |
|---|---|---|---|
| Feature extractor | Frozen ResNet | Frozen ResNet | Same |
| Clustering | Agg-Var with D | Agg-Var with D | Same |
| Raw images kept | No | No | Same |
| Stored per centroid | Mean, count | Mean, count, covariance | Different |
| Fake features | None | From each centroid's mean and covariance | Different |
| What gets trained | Nothing after clustering | A linear softmax layer | Different |
| Trained on | — | Few images: about 40 fake features per class. All images: real new, fake old | Different |
| Memory budget K, in the thesis | CIFAR-100 7,500 Caltech-101 1,100 CUBS-200-2011 800 | CIFAR-100 1,600 Caltech-101 1,000 CUBS-200-2011 600 | Different |
Testing phase
| Testing | CBCL | CBCL-PR | |
|---|---|---|---|
| Features | Same frozen ResNet | Same frozen ResNet | Same |
| Tested on | All classes seen so far | All classes seen so far | Same |
| Decision | Vote of n nearest centroids | Highest softmax probability | Different |
| Needed at test time | All centroids and class counts | Only the layer's weights | Different |
| Prediction time | Grows with the centroids stored | Grows only with the number of classes | Different |
| Settings tuned | D and n | D reused from voting. n isn't used | Different |
| Accuracy in this test | Lower in all 7 settings where both ran | Higher in all 7. See Results | Different |
Both together
The full architecture in one picture. Select it to open it full size.
Datasets
The three datasets used in the thesis, from easy objects to very similar birds. Each picture shows the classes with sample images. Select one to open it full size.
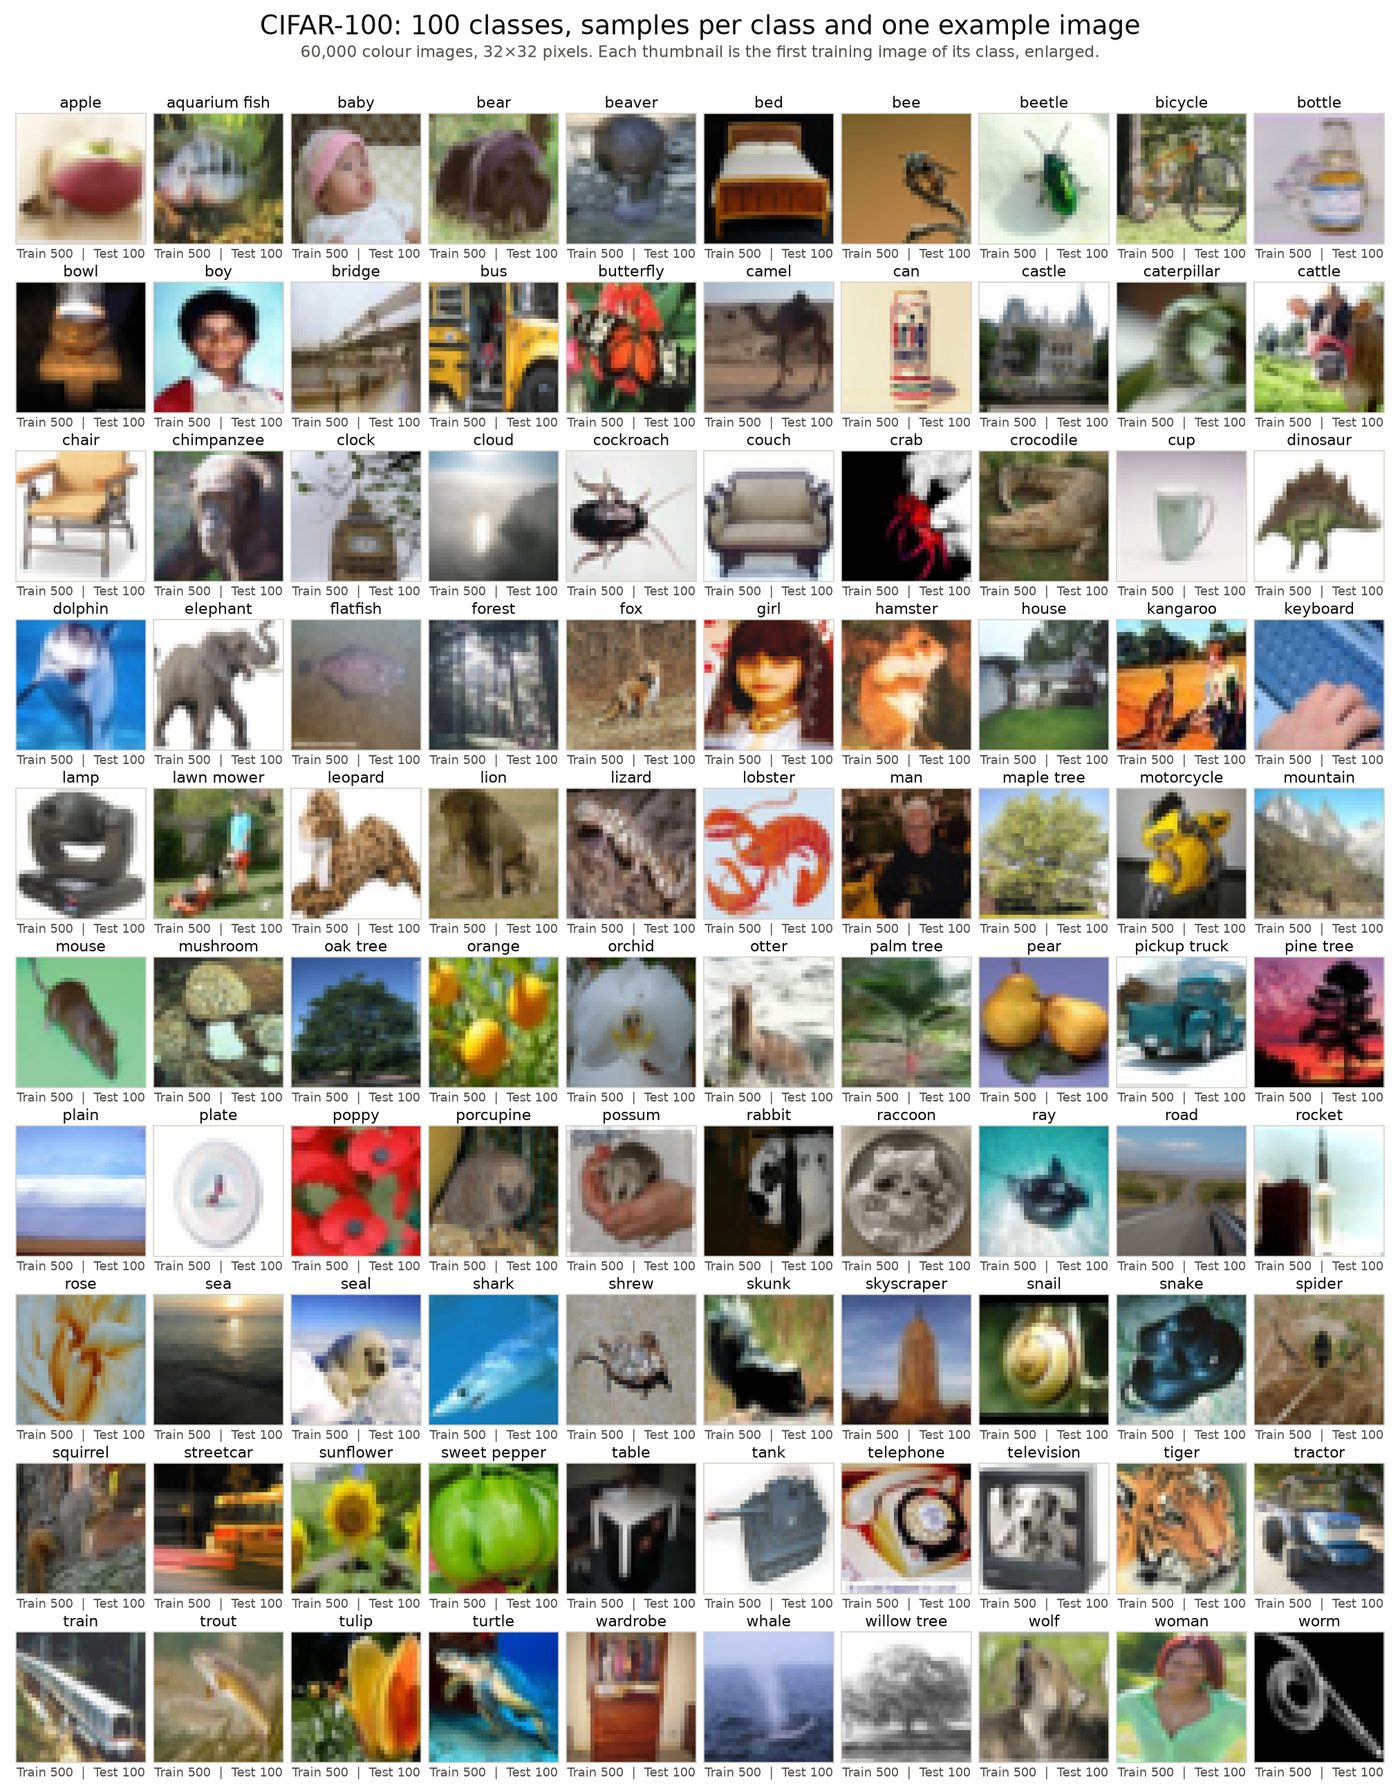
CIFAR-100
Everyday objects, animals, people and scenes, in very small images.
| Classes used | 100 |
|---|---|
| Images | 60,000, 32×32 pixels |
| Split | 500 training and 100 test images per class |
| Features | ResNet-34 |
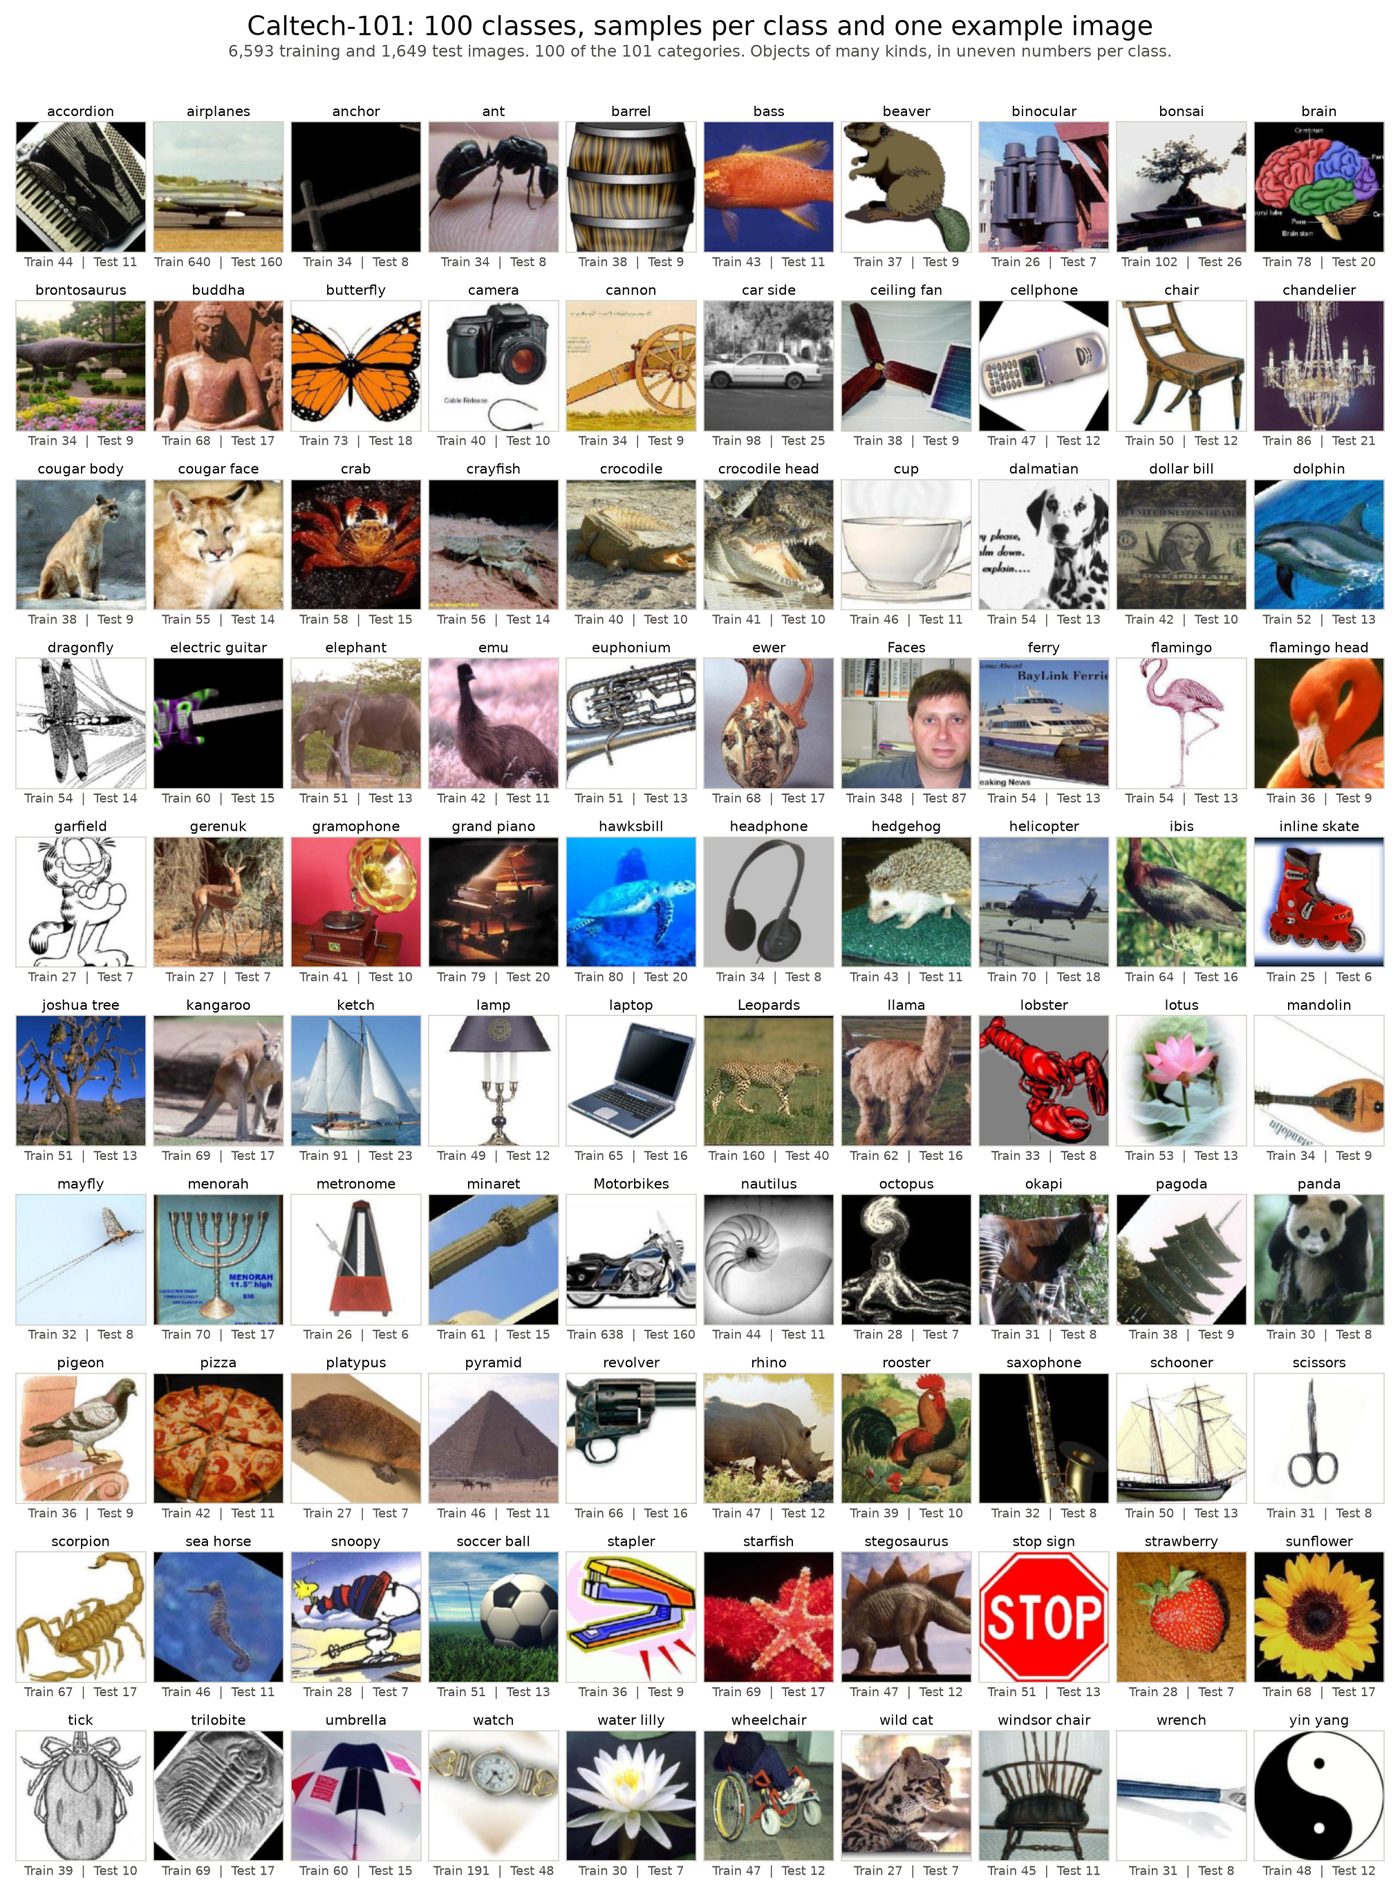
Caltech-101
Objects in larger, cleaner images, with classes of very different sizes.
| Classes used | 100 of 101 |
|---|---|
| Images | 8,677, of varying size |
| Split | 80% training, 20% test, per class |
| Features | ResNet-18 |
The thesis doesn't say which category it left out. Here, Faces_easy is dropped, as it's a tighter crop of the images in Faces.
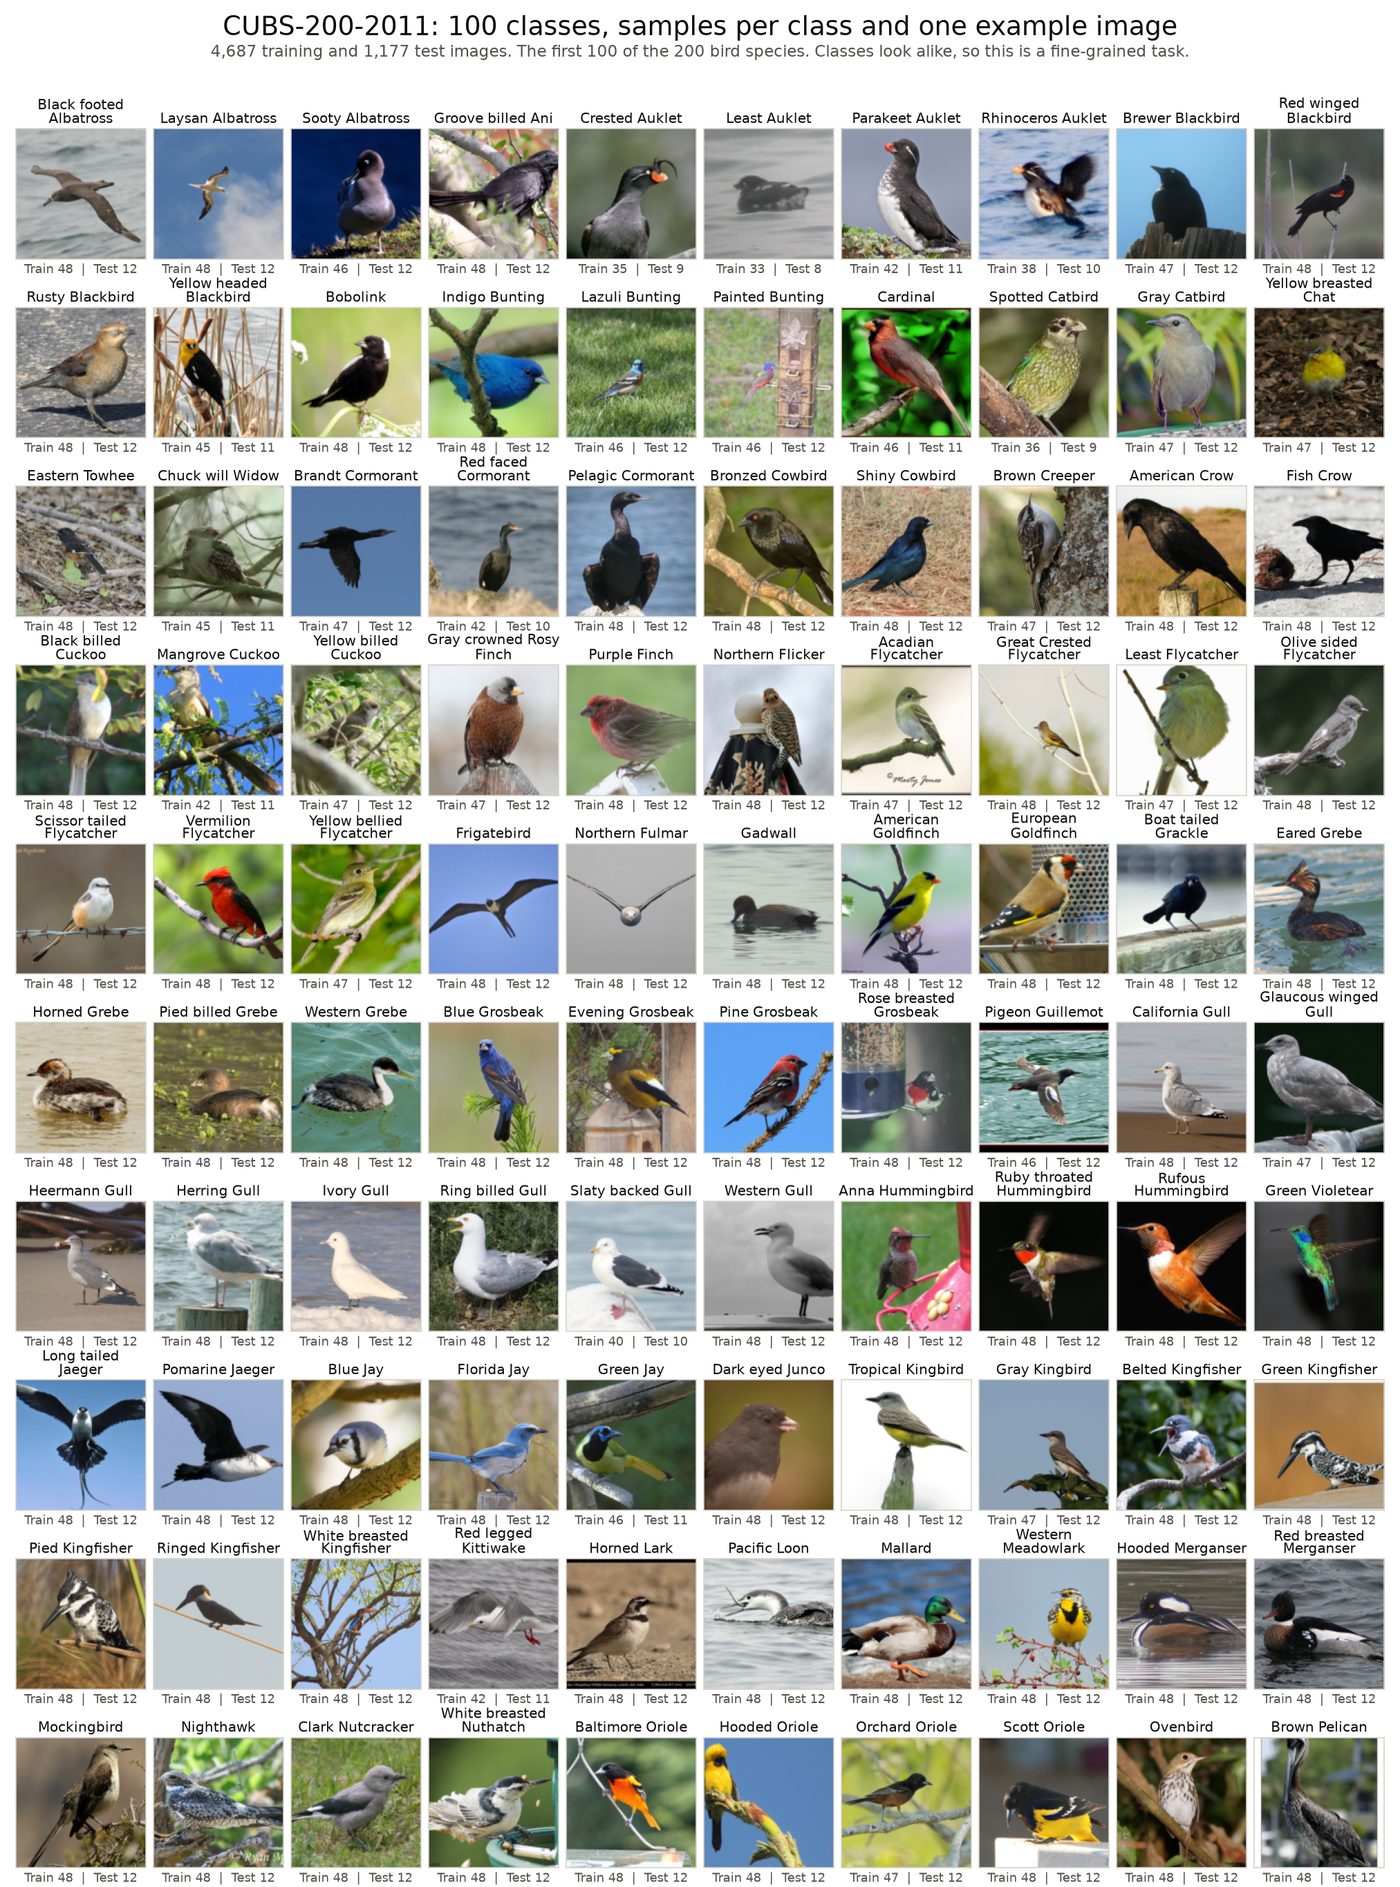
CUBS-200-2011
Bird species that look very alike, so it's the hardest of the three to separate.
| Classes used | 100 of 200 |
|---|---|
| Images | 11,788 in the full set, of varying size |
| Split | 80% training, 20% test, per class |
| Features | ResNet-18 |
The thesis doesn't say which 100 species it used. Here, it's the first 100 in the dataset's order. Usually written CUB-200-2011.
Experiments
The aim is to see how closely an independent rebuild of CBCL and CBCL-PR matches the numbers in Ali Ayub's thesis (Tables 3.2 and 6.1 for few images).
How each run works
Each box is 10 classes. Score: average incremental accuracy is the mean of the 10 test results. Each result is a mean of per-class accuracies, as in the official code.
What was run
The number of runs for each setting. A dash means it wasn't run.
The thesis uses 10 runs and also other step sizes. Only 10 classes per step was tested here. FLB is the thesis's baseline: a linear layer trained on all real features seen so far, using SGD, learning rate 0.001, batch size 8 and 25 epochs.
How parameters were chosen
| Parameter | What it controls | How it was chosen | Values |
|---|---|---|---|
D | How close an image must be to join a centroid | Tuned at each step, as a multiple of the typical distance between two images of the same class | 0.3, 0.5, 0.6, 0.7, 0.8, 0.9, 1, 1.2, 1.5, 2 or 3 × that distance |
n | How many centroids vote | Tuned at each step, together with D | 1, 3, 5, 7, 10, 15 or 25 |
K | Memory budget, in centroids | From the thesis. Applied in the all-images runs. A D that would overflow K is ruled out | See Comparison |
| Fake features | Training samples per class in CBCL-PR | From the thesis, for few images | 40 per class |
| Covariance | Shape of each centroid's spread | Full for 5 and 10 images. Diagonal for all images | Full runs sample from a centroid's own features during the run, to avoid forming a 512×512 matrix |
| Linear layer | CBCL-PR's classifier training | From the thesis | SGD, momentum 0.9, learning rate 0.01, batch 64, 25 epochs + 5 per step |
How D and n are tuned
- Only the new classes' training images are used, so test images are never seen, and neither are old images.
- Fewer than 25 images in a new class: hold out one image per class in turn, for up to 5 folds. Otherwise: a single 80/20 split.
- Each pair of D and n is scored by voting, using the centroids learned so far. The best pair is used for that step.
- CBCL-PR reuses the D chosen by voting, rather than retraining its layer for every candidate.
What tuning chose
CBCL with the thesis's voting formula. Each run tunes 10 times, so a setting has one value per step per run.
| Dataset | Images per class | Typical same-class distance | Median D | D range | Most common n |
|---|---|---|---|---|---|
| CIFAR-100 | 5 | 22.67 | 27.2 | 6.8–34.0 | 7 (22 of 100) |
| Caltech-101 | 5 | 18.61 | 27.9 | 5.6–37.2 | 3 (17 of 30) |
| Caltech-101 | 10 | 18.61 | 22.3 | 5.6–27.9 | 3 (17 of 30) |
| Caltech-101 | All | 18.61 | 27.9 | 18.6–55.8 | 1 (30 of 30) |
| CUBS-200-2011 | 5 | 17.83 | 26.7 | 5.3–35.7 | 5 (10 of 30) |
| CUBS-200-2011 | 10 | 17.83 | 21.4 | 12.5–35.7 | 3 (12 of 30) |
| CUBS-200-2011 | All | 17.83 | 26.7 | 17.8–53.5 | 3 (11 of 30) |
Where this differs from the thesis
- Different weights: this test uses torchvision's ResNet weights. The official code uses Keras weights.
- Different image choice: few-image sets are random, because the published code doesn't show how they were selected.
- My own choices: the thesis doesn't state how D and n are searched. Results could change with other choices.
- Voting formula: the thesis and the official code use different formulas, so both were tested with 5 images per class.
- Gaps are unexplained: a gap here doesn't mean the original work is wrong. It may come from any of these differences.
Results
- Only one schedule was tested: 10 new classes at each step.
- Most results use 3 runs. The thesis uses 10.
- The CIFAR-100 CBCL and CBCL-PR results predate a later change to how
Dis tuned, and haven't been rerun.
Accuracy as classes are added
Move over the chart to read values. Select a method in the legend to hide or show it.
Show these values as a table
This test against the thesis
Average incremental accuracy for the dataset chosen above, using the thesis's voting formula.
Show all 19 comparisons as a table
The all-images CBCL-PR runs use diagonal covariance. The others use full covariance. Standard deviations are over the runs shown, and with 3 runs they understate the true variation.
What the comparison shows
The method order mostly agrees with the thesis. In 4 of the 5 few-image settings, the order was the same: CBCL-PR, then CBCL, then the FLB baseline. In Caltech-101 with 10 images, FLB beat CBCL here, but not in the thesis. CBCL-PR beat CBCL in all 7 settings where both ran, as it did in the thesis.
Accuracy is usually close, but not everywhere. Of 19 comparisons, 6 were within 2 points of the thesis, 8 more were within 5 points, and 5 were further away. 16 of the 19 were below it. The largest gap was CBCL on Caltech-101 with 10 images, at 11.52 points below.
The voting formula can matter
CBCL with 5 images per class. The two formulas gave different results, particularly on Caltech-101 and CUBS-200-2011. This could explain part of the gaps above, but I haven't tested that, and each official-formula result rests on only 3 runs.
Show these values as a table
More
The online dashboard shows these results with more detail. It's read-only, because teaching new objects by camera or upload needs a Python backend running on a local computer.